Concepts
For the sake of statistical analysis a flight trajectory can be broken down to a discrete set of EVENTs that represent key milestones useful for a specific study.
These events are characterized by a location and a time of occurrence, e.g., in the case of a flight level crossing event the longitude, latitude, altitude and timestamp of where/when it occurs.
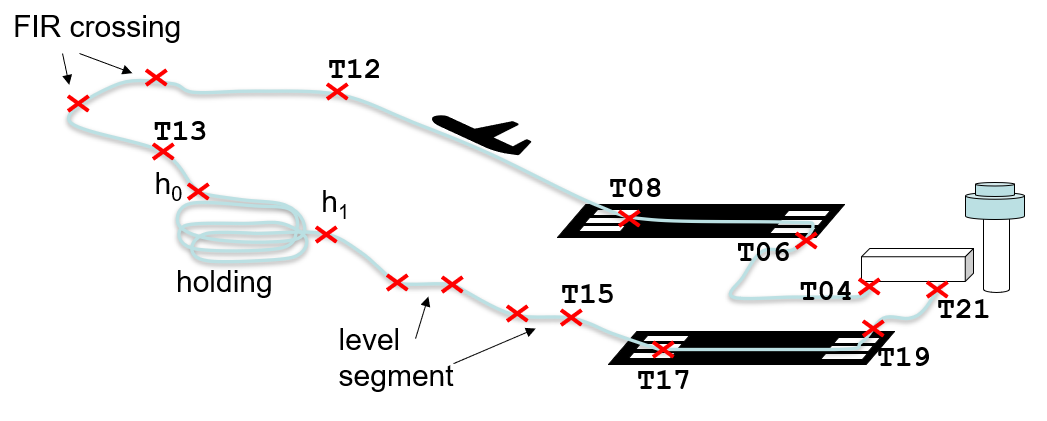
Certain phenomena cannot be modeled by single 4D1 instants, i.e. flown level segment or holding segments. In these cases the EVENT concept can still be used, we can capture the start and the end of this phenomenon as two separate event types and process them as a pair during the analysis.
The concept of MEASUREMENT is then used when associating specific metrics to the events of interest. Example of measurements for flight trajectories are (cumulative) flown distance or emitted CO2.
The Open Performance Data Initiative and the relevant data sets are made openly available in order to promote transparent and reproducible performance analysis.
These tables are currently derived from ADS-B trajectory data kindly made available by OpenSky Network (OSN).
Later releases of the OPDI data sets will be integrated and complemented by information from other data sources in order to either include validations and corrections or extend the data sets. See our Roadmap page for planned enhancements.
![]()
Flight List
A flight list contains basic information about each trajectory. It captures the Aerodrome of Departure (ADEP) where it is first seen (first_seen) usually at the off-block time and the Aerodrome of Destination (ADES) where it last seen (last_seen) before in-block time. The flight is usually identified by an id or its FLT_ID (i.e., the callsign) and ICAO24. The date of flight (DOF) indicates the date on which is is first seen.
This flight list is constructed to give a general overview of the flights which happen each day.
Flight Events and Phases
As mentioned, in a flight we can identify events that can help to monitor its evolution from a gate-to-gate perspective. A flight event or milestone is conceptually defined by
- The flight trajectory
idit belongs to. - The 3D location:
longitudeandlatitude(in WSG84),altitude(in feet), e.g.,32000 ft.
- The
event_timewhen the event took place (UTC). E.g.,2021-09-27 10:43:11.234 UTC. - The event
type, i.e.top-of-climboroff-block. - The
sourceindicates the origin of the flight trajectory used to determine the event (e.g.,OSN). - The
versionindicates the algorithm version used to detect the flight event. For more info, see Methodology. - Additional
infois captured at last. This can be contextual information, i.e.F33Ras the relevant parking position for anoff-blockmilestone or26as the Runway (RWY) ID for atake-offmilestone.
A Flight phase is a prolonged event which can be broken down into a start event and an end event of the phase. Figure 1 shows a simplified diagram of a possible set of flight phases (white square boxes) and relevant flight events (Txy labels).
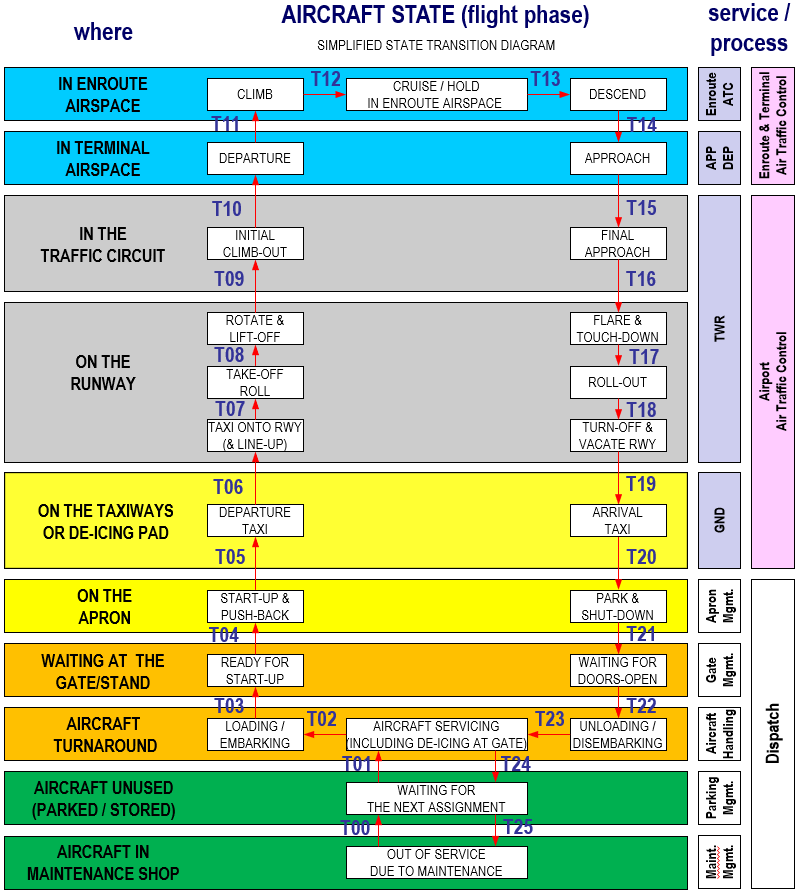
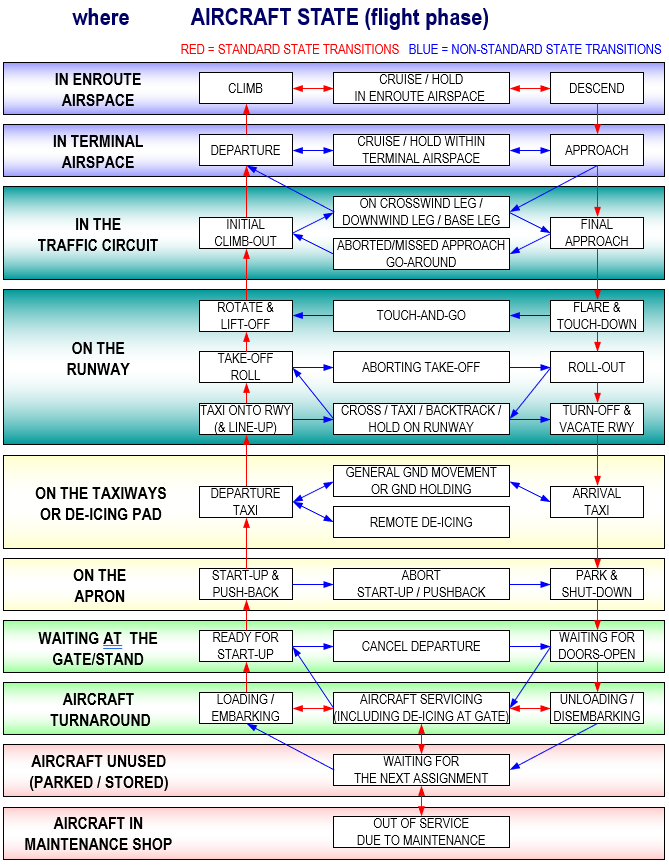
The events in Figure 1 are:
T00= time of maintenance completionT01= time aircraft servicing beginsT02= time aircraft loading beginsT03= time aircraft is ready for pushbackT04= time off-blocksT05= pushback complete - parking position vacated - start taxiT06= start taxi onto take-off runwayT07= start take-off rollT08= start rotationT09= positive rate of climb establishedT10= time aircraft reaches safety altitude and leaves traffic circuitT11= time aircraft enters en-route airspaceT12= time of Top of ClimbT13= time of Top of DescentT14= aircraft enters terminal airspace and starts approachT15= aircraft established on final approachT16= aircraft over runway thresholdT17= time of touchdownT18= time aircraft starts turn-offT19= time runway is vacatedT20= aircraft starts manoeuvring into parking positionT21= on-blocksT22= time unloading beginsT23= unloading completedT24= arrival servicing completedT25= start of maintenance
Examples of usage:
T04–T06= Taxi-outT19–T21= Taxi-inT08–T17= Airborne timeT04–T21= block-to-block timeT06–T08= Runway occupancy time (departure)T04–T05= Pushback delayT03–T22= Turnaround time
In general, we are interested in analyzing performance at gate-to-gate level so as to cover both the airborne and the ground phases of flights. To this extent we summarize a flight down to some of its fundamental flight events as in the following list (from departure to arrival):
- Off-block (T04)
- End of push back (T05)
- Enter runway for take-off (T06)
- Lift-off (T08), a.k.a. take-off
- 40-nautical-miles intersection (sort of T11)
- Top-of-climb (T12)
- Top-of-descent (T13)
- 40-nautical-miles intersection (sort of T14)
- Touch-down (T17)
- Runway vacated (T19)
- Enter parking spot (T20)
- On-block (T21)
Other interesting flight events are:
- Holding start
- Holding end
- Leveled segment start
- Leveled segment end
- Flight Information Region (FIR) crossing
These additional ad hoc milestones can be used for specific reports, for example Flight Information Region (FIR) crossings could be useful to count Departure, Arrival, Internal, Overflight (DAIO) statistics.
Measurements
Once the flight EVENTs are available, it is informative to see associated metrics or MEASUREMENTs for each flight event. An example of this is the cumulative distance flown or the (cumulative) CO2 emitted.
A MEASUREMENT is thus identified by:
- A link to the event, by an
event_id. - The
typeof measurement (e.g., distance flown (NM) or emitted CO2). - The
valueof the measurement (e.g., 400 NM or 5000 kg). - The
versionindicates the specific algorithm used.
Use Cases
An event-based representation of a flight is a way to reduce complexity for its representation and allow statistical analysis for performance monitoring.
Operational Performance Monitoring
One of the possible use cases for an event-based representation of a flight, could be the monitoring of the International Civil Aviation Organization (ICAO) Global Air Navigation Plan (GANP) Key Performance Indicator (KPI)s. Thus operational indicators could be extracted for the analysis of the operations performance at network, state, airport or airline level.
For example using the touch-down (T17 in Figure 1) with the contextual information (RWY identification) we can calculate RWY utilization at each airport or inter-arrival times, etc.
 Possible monitoring usages are:
- Airport performance (Throughput, RWY utilization, …)
- Fuel efficiency & CO2/NOx Emissions
- Airline profiling
- Safety: separation, …
- Influence/resilience to Meteo events
Fuel Consumption and Environmental Emissions
Environmental emissions and climate impact are indicators more and more in news headlines and on the political agendas. With a event-based representation of a flight we can segment the phases of interest and calculated the relevant cumulative emissions.
For example we can split a flight in the following phases:
- Cruise
- Landing and TakeOff (LTO) cycle
and calculate the fuel-burnt emissions by further splitting them.
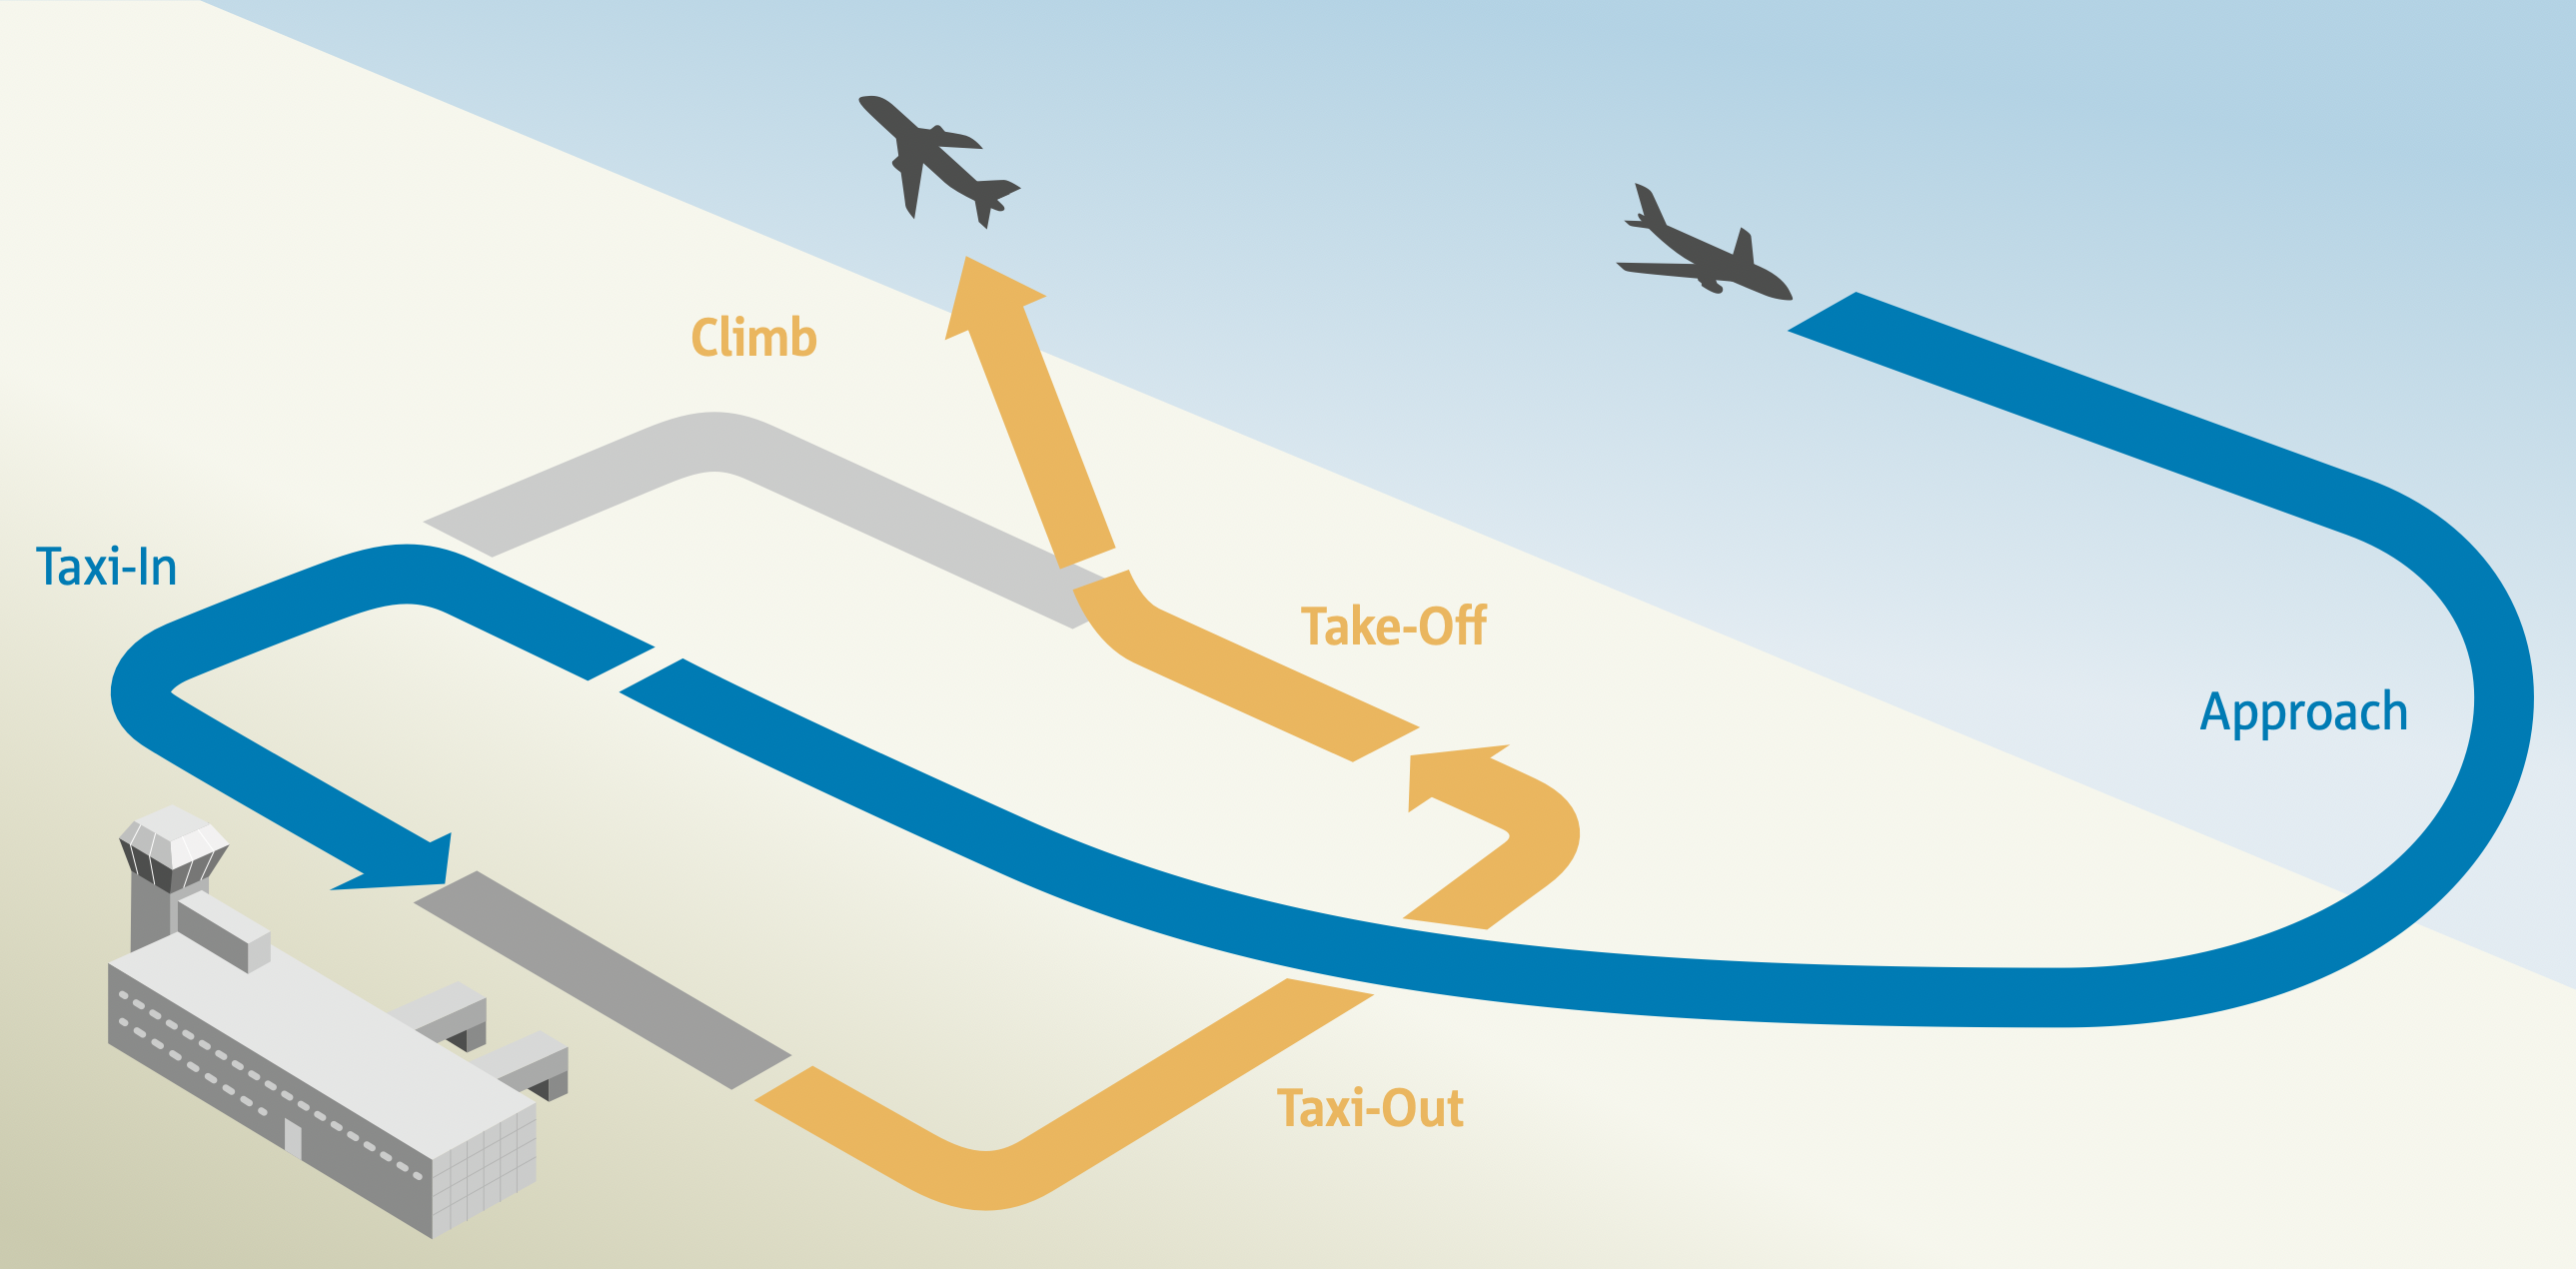
For LTO we have four sub-phases:
- Approach
- Taxi-in
- Taxi-out
- Take-off
- Climb-out
The taxi-out sub-phase can be framed by the ground portion from off-block to rwy-entry event which with defined assumptions in term of aircraft & engine type, full thrust percentage and number of engines in use can be handled to an emission calculator to compute CO2, NOx, … emissions.
The selection of flight events to model the flight and the further assumptions of how the aircraft is operated between those milestones will produce results with different levels of accuracy and precision.
Airspace profile
Milestones line FIR crossing (x-fir) could be used to extract a flight airspace profile. For example we could have AUA crossing (x-aua) or even elementary airspace (x-esa) ones. The tricky thing is obviously having a non-overlapping airspaces (of the same type)
List of Acronyms
- ADEP
- Aerodrome of Departure
- ADES
- Aerodrome of Destination
- DAIO
- Departure, Arrival, Internal, Overflight
- FIR
- Flight Information Region
- GANP
- Global Air Navigation Plan
- ICAO
- International Civil Aviation Organization
- KPI
- Key Performance Indicator
- LTO
- Landing and TakeOff
- OSN
- OpenSky Network
- RWY
- Runway